I hope you get value out of this blog post.

If you want to see how you can communicate value to your clients, schedule a demo here. click here.

Quickly find out good performers vs. bad

Date: November 17, 2019

Another resource to share with the financial advisor community. Over the years when I was responsible for portfolio research, I found this website with its heatmap a very helpful tool to quickly focus on the answers I needed.

Sometimes it was to find a stock that has been beaten up. Other times it was too look at what industry was dragging down the performance overall.

I just pulled this chart today that shows you that Independent Oil has been challenged this year. Or while tech has been flying, BIDU not so much. You can pull so much from such a simple visual.

https://www.finviz.com
YTD Heatmap - Nov 17 2019

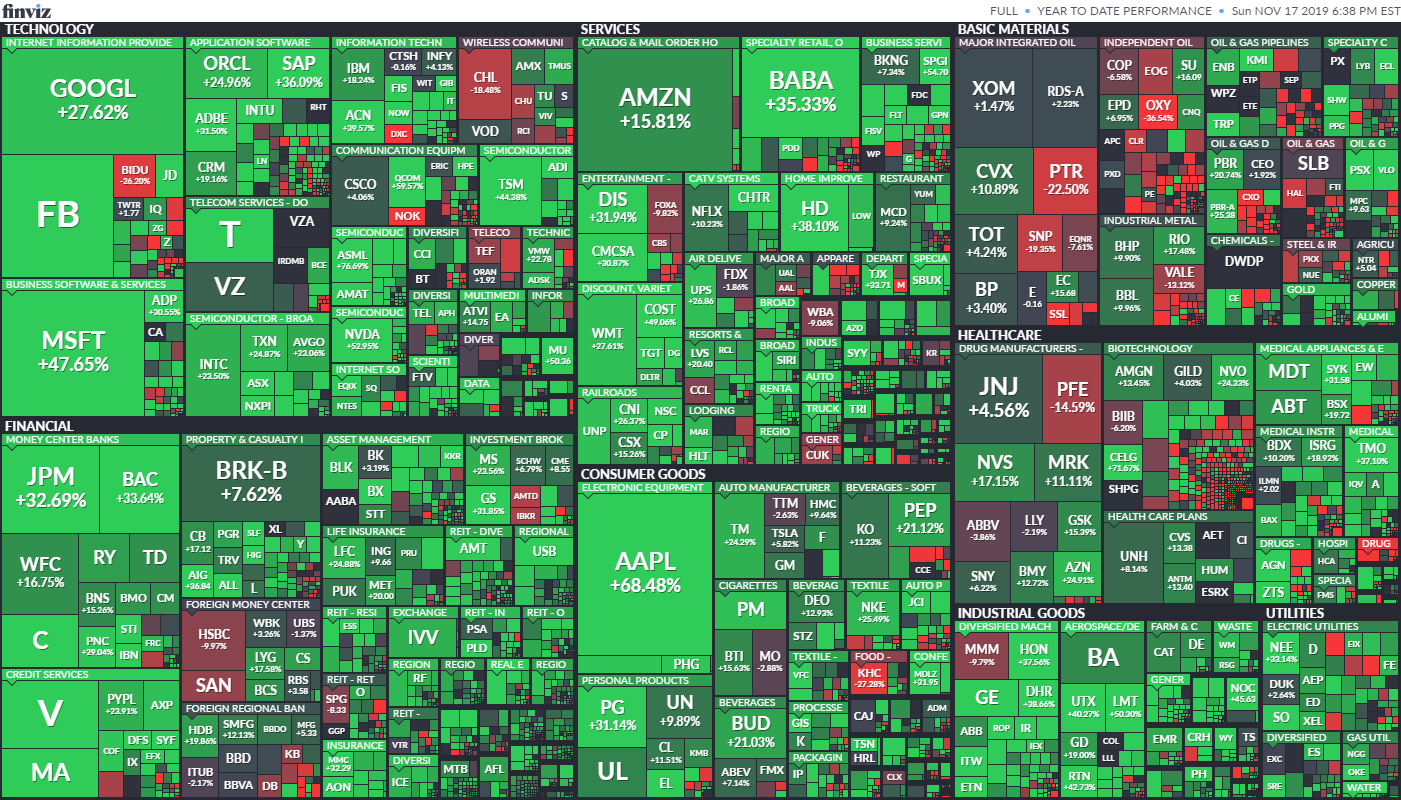
Check out the website - https://www.finviz.com - they have great tools. Share with your team.

Show Prospects
Your Value

Download customizable advisor services graphic to show clients and prospects what you do.

And for advisor insights, opinions (and maybe a little bit of humor!) delivered direct to your inbox.
Newsletter Form (#6)
Financial Advisor COO

About Us

You can be 50% more productive. That's what we believe in and what we are about.

With two decades of experience doing what you do every day, our founder, Anand decided to build automation technology for financial advisors like you.
See Yourself

Show Prospects Your Value

Download customizable advisor services graphic to show clients and prospects what you do.

And for advisor insights, opinions (and maybe a little bit of humor!) delivered direct to your inbox.
Newsletter Form (#6)
Made with ❤️ in Riverside, CA & Farnham, UK
© 2024 Pulse360, Inc. All rights Reserved.